Customized Irrigation
Customized irrigation schedules for each farm based on the soil type and crop stage
Sugarcane programs run with sugar mills. Paddy programs run with corporates and carbon buyers. The IoT, AI, and field operations underneath are shared built once, deployed twice.
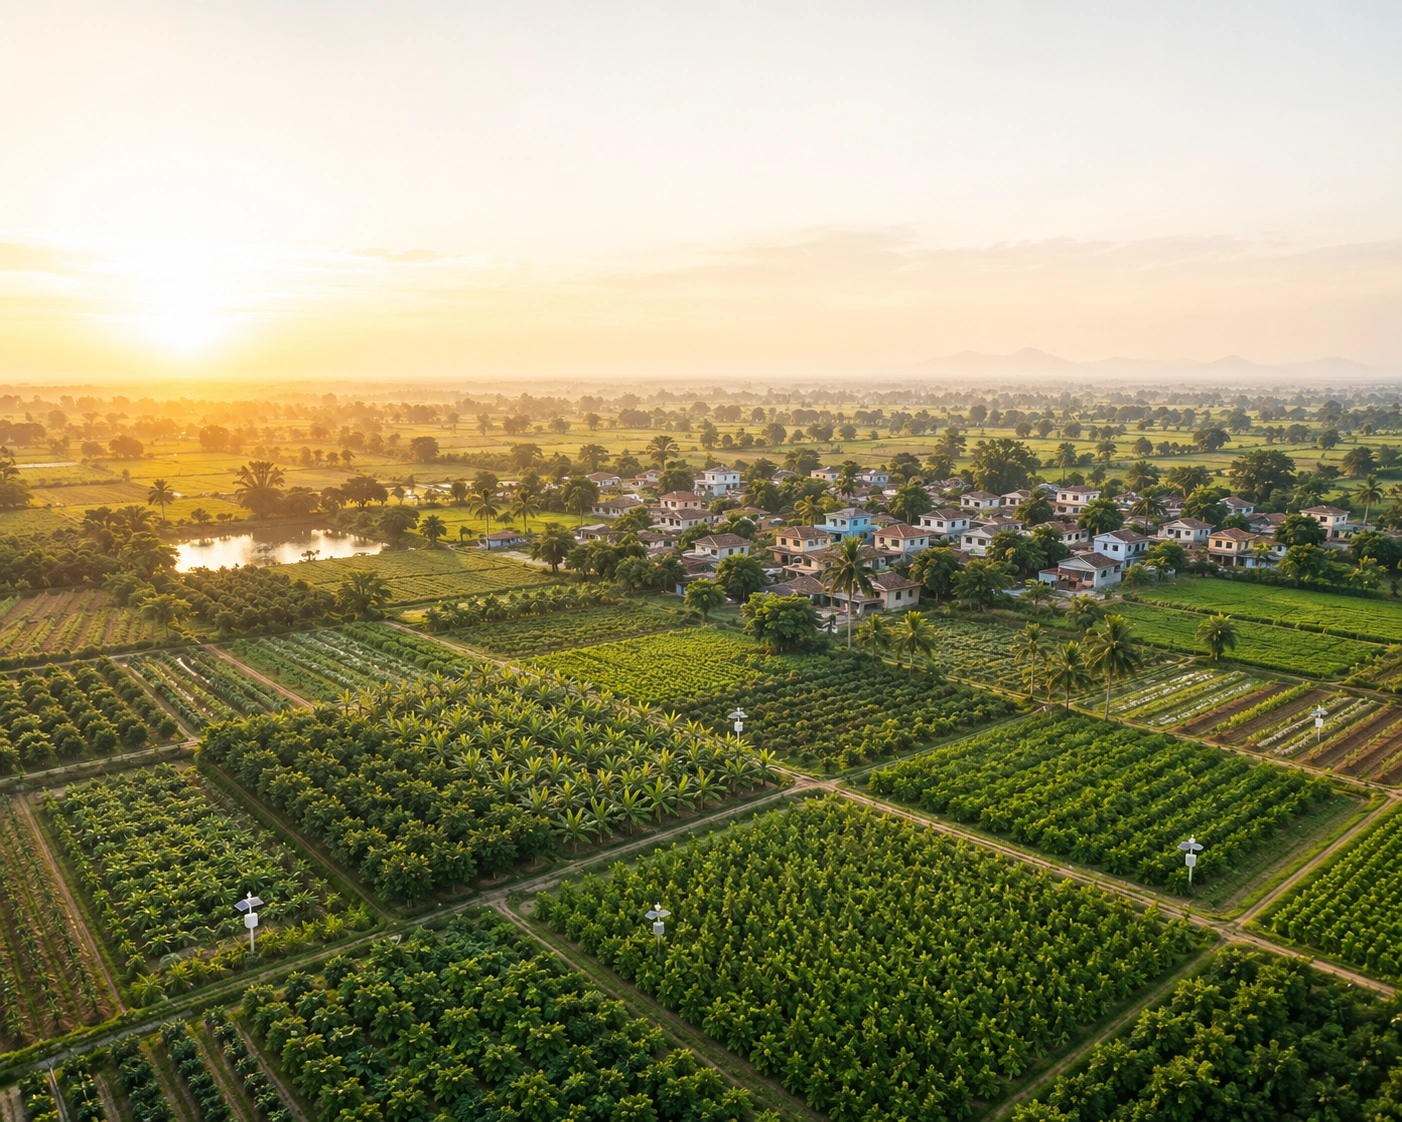
We combine on-field IoT sensors, satellite and weather data, AI-driven crop models, and a field officer network into a single platform. Sugar mills, corporates, and carbon programs use it to deliver verified outcomes — water saved, yield gained, carbon credits earned.
Customized irrigation schedules for each farm based on the soil type and crop stage
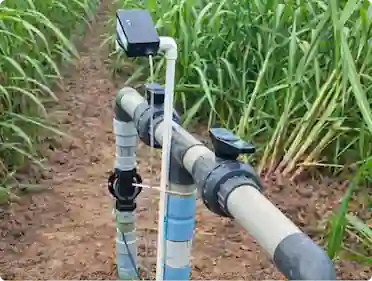
Real-time data from on field IoT sensors and remote sensing and weather feeds
No cable tangle for quick integration with existing drip irrigation installations

Integration of autonomous irrigation with crop/soil specific PoP, leading to predictable outcomes
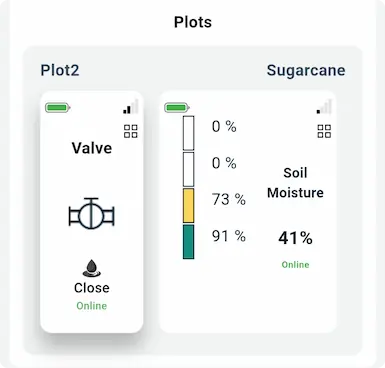
Precise irrigation advice are sent to farmers using sensors and crop models to improve yield and save water
Mobile-first guidance for farmers. Real-time dashboards for partners. Available across sugarcane and paddy programs.
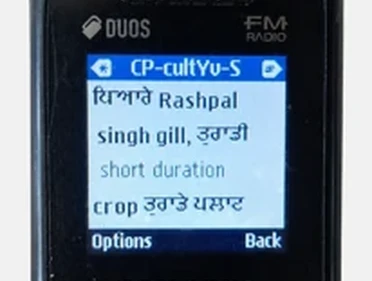
Precise irrigation advice for paddy farmers using AWD sensors and crop models — improves yield and saves water.
Enrol in our Gold Standard–certified carbon program via our MRV platform. Earn carbon credits by adopting AWD practices.
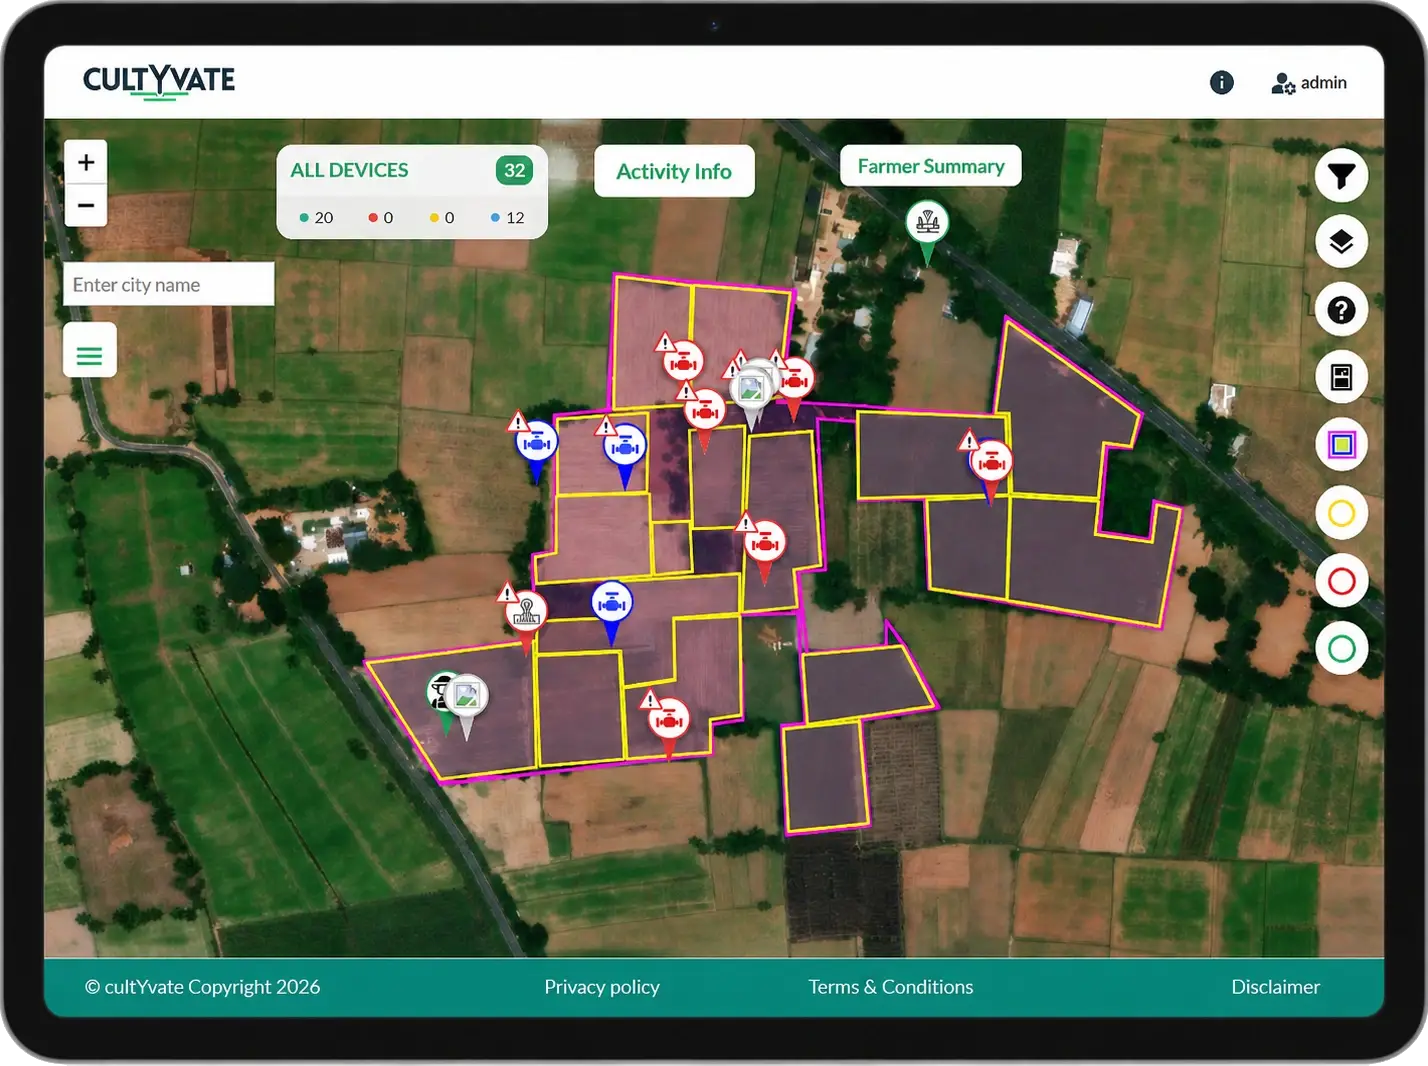
cultYvate's geospatial dashboard gives farm coordinators a real-time, bird's-eye view of every IoT device deployed across farmer plots. Color-coded pins on a satellite map instantly communicate device status — active, idle, or flagged for attention, while plot boundaries help teams visualize coverage across the entire cluster.
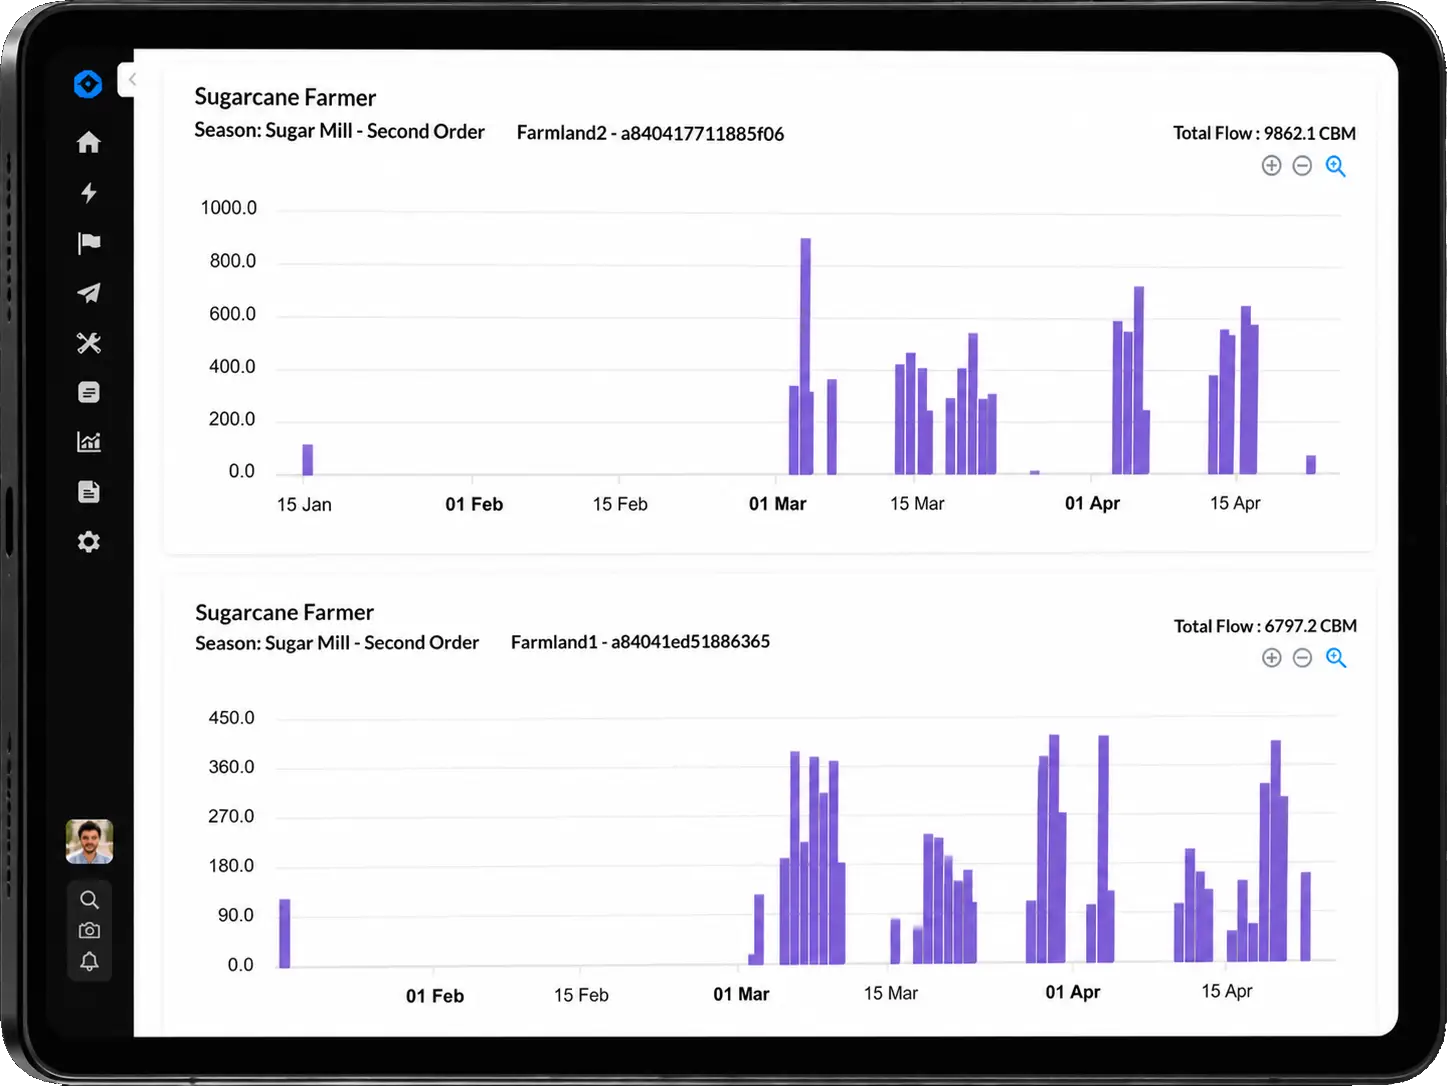
This dashboard tracks cumulative irrigation water consumption across individual farmland plots for sugarcane farmers, measured in cubic metres (CBM). Season-wise bar charts reveal daily flow patterns, peak usage periods, and total water drawn. Giving mills, agronomists, and farmers a transparent record of water utilization. This data directly supports water audit requirements and helps identify opportunities for more efficient irrigation scheduling.
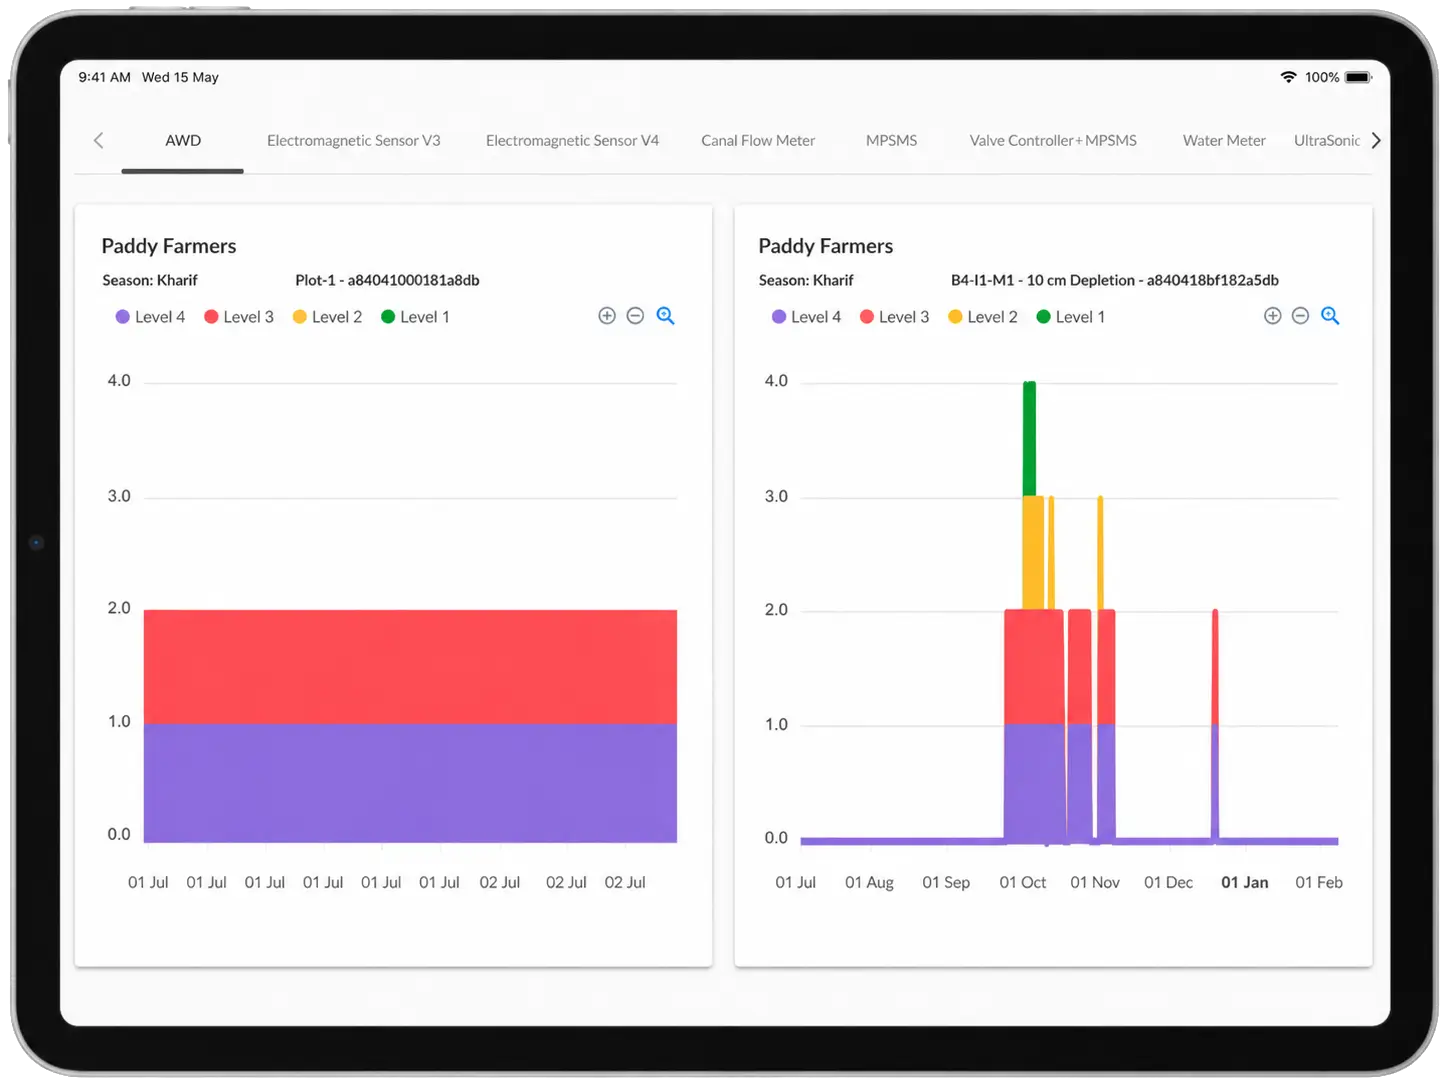
CultYvate's Alternate Wetting and Drying (AWD) dashboard monitors real-time soil water depletion levels across paddy plots throughout the Kharif season. Multi-level color indicators show whether a field is at optimal dryness for re-irrigation or still holding water — enabling farmers to time irrigation precisely rather than irrigating continuously. This data-driven approach reduces water use significantly while protecting yields, forming the foundation of CultYvate's water conservation and carbon measurement programmes.
TECHNOLOGY PLATFORM

Two crops. Two partnership models.
Sugarcane programs run with sugar mills. Paddy programs run with corporates and carbon buyers.